ActiveMQ is a great messaging broker. However, using the default configuration is not recommended. This article will explain how I determined the appropriate ActiveMQ memory settings for one of our partners.
I recently helped a partner with a production issue involving a large java web application that used ActiveMQ as the messaging broker. Right after a production deployment the system started having performance issues. Users started getting HTTP 500 errors while using the system. A few times the ActiveMQ broker would stop functioning. The activemq.log file showed errors similar to:
Usage(default:memory:queue://Consumer.AppOne.VirtualTopic.Process.Incoming:memory) percentUsage=100%, usage=1048828, limit=1048576, percentUsageMinDelta=1%;Parent:Usage(default:memory) percentUsage=0%, usage=4414167, limit=1073741824, percentUsageMinDelta=1%: Usage Manager Memory Limit reached. Producer (ID:hostname-22563-1396035238078-1:1:2:1) stopped to prevent flooding queue://Consumer.AppOne.VirtualTopic.Process.Incoming. See http://activemq.apache.org/producer-flow-control.html for more info (blocking for: 301s)
Initial Solution
After reviewing the ActiveMQ documentation, it was decided to increase the broker memoryUsage value from 64 MB to 1024 MB in the activemq.xml configuration file. This change was made and initially this seemed to fix our problem. However, the problem happened again.
Further Analysis
From reading the ActiveMQ performance documentation, I was certain that the problem was with the broker configuration. My conclusion was that we probably only had a few queues that were used the most and need the most memory. Consequently, I asked the system administrator to gather some statistics on the dequeued statistics for each queue. I figured the statistics would tell us which queues were used the most and therefore needed the most memory.
The system administrator provided the following statistics, which represented the broker usage over a short period of time:
|
Queue Name |
Number Of Pending Messages |
Number Of Consumers |
Messages Enqueued |
Messages Dequeued |
|
|
Consumer.AppOne.VirtualTopic.Data.Incoming |
0 |
6 |
114 |
120 |
|
|
Consumer.SchedulerOne.VirtualTopic.Scheduler |
0 |
6 |
16 |
16 |
|
|
Consumer.AppOne.VirtualTopic.Process.Incoming |
0 |
6 |
43861 |
43861 |
|
|
Consumer.AppOne.VirtualTopic.Process.Result |
0 |
6 |
43740 |
43861 |
|
|
Consumer.AppTwo.VirtualTopic.Process.Result |
0 |
6 |
43740 |
43861 |
|
|
Consumer.Data.VirtualTopic.Data.Outgoing |
0 |
6 |
120 |
121 |
|
|
Consumer.Email.VirtualTopic.Email |
0 |
6 |
526 |
526 |
|
|
Consumer.AppTwo.VirtualTopic.Data.Incoming |
0 |
6 |
114 |
114 |
|
|
Consumer.AppThree.VirtualTopic.Process.Result |
0 |
6 |
43861 |
43861 |
|
|
Consumer.AppFour.VirtualTopic.Process.Result |
0 |
6 |
43861 |
43861 |
|
|
Consumer.AppFive.VirtualTopic.Process.Result |
0 |
6 |
43861 |
43861 |
|
|
Consumer.SchedulerTwo.VirtualTopic.Scheduler |
0 |
6 |
16 |
16 |
|
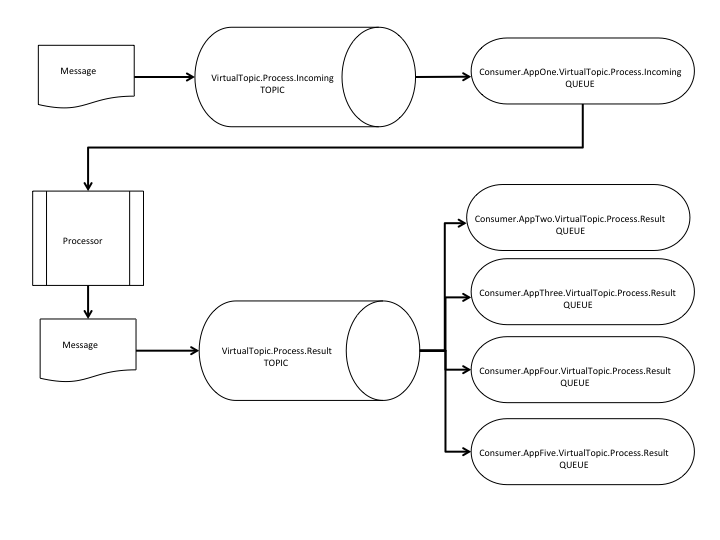
These statistics made sense because for every single process, we are generating 5 messages: 1 message to the incoming queue and 4 messages to the result queues.
Unit Testing
To re-create the problem locally on my developer workstation, I decided to scale down the memory settings in ActiveMQ so that I could cause memory errors in a repeatable way. I created a jUnit test that uses a JMS client to send messages similar to the messages that were trying to be processed when we were having the production issues. I found it very helpful to turn on ActiveMQ debugging for my local workstation instance.
While I could never re-create the scenario exactly, I did manage to get ActiveMQ to log an error similar to the one we were seeing in production:
Usage Manager Memory Limit reached on queue:// Consumer.AppOne.VirtualTopic.Process.Incoming. Producers will be throttled to the rate at which messages are removed from this destination to prevent flooding it. See http://activemq.apache.org/producer-flow-control.html for more info
Usage Manager Memory Limit is full. Producer (ID:hostname-54268-1397663151780-1:1:4:1) stopped to prevent flooding queue:// Consumer.AppOne.VirtualTopic.Process.Incoming. See http://activemq.apache.org/producer-flow-control.html for more info (blocking for: 12s)
Armed with the knowledge that I could cause the error, I set out to test various combinations of the ActiveMQ memory settings to see what the behavior would be. The following table shows the results of these tests:
|
Test Run |
memory Usage |
store Usage |
temp Usage |
Topic memory Limit |
Queue memory Limit |
Process queues memory Limit |
Caused Error |
|
1 |
20 mb |
1 gb |
100 mb |
1 mb |
1 mb |
n/a |
N |
|
2 |
20 mb |
1 gb |
100 mb |
1 kb |
1 kb |
n/a |
Y |
|
3 |
20 mb |
1 gb |
100 mb |
500 kb |
500 kb |
n/a |
N |
|
4 |
1 mb |
1 gb |
100 mb |
500 kb |
500 kb |
n/a |
N |
|
5 |
1 mb |
1 gb |
100 mb |
100 kb |
100 kb |
n/a |
N |
|
6 |
1 mb |
1 gb |
100 mb |
10 kb |
10 kb |
n/a |
N |
|
7 |
1 mb |
1 gb |
100 mb |
1 kb |
1 kb |
n/a |
N |
|
8 |
100 mb |
1 gb |
100 mb |
1 kb |
1 kb |
n/a |
Y |
|
9 |
100 mb |
1 gb |
100 mb |
10 kb |
1 kb |
n/a |
Y |
|
10 |
100 mb |
1 gb |
100 mb |
1 kb |
10 kb |
n/a |
N |
|
11 |
100 mb |
1 gb |
100 mb |
1 kb |
1 kb |
100 mb |
N |
|
12 |
100 mb |
1 gb |
100 mb |
1 mb |
1 mb |
100 mb |
N |
The column named Process queues memory limit refers to a new policy entry that I added to the ActiveMQ configuration file to change the memory settings used for just the queues with VirtualTopic.Process.Result in their name:
<policyEntry queue="*.VirtualTopic.Process.Result" producerFlowControl="true" memoryLimit="100mb"/>
Final Solution
Based on my local unit testing results, it was clear that we needed to make some changes to the ActiveMQ memory settings.
To determine the best memory settings, I assumed the following conditions:
- 5 messages per calculation are stored in memory on the broker.
- Each message is 1 kb in size.
- Maximum number of processes that would be requested at one time is 100,000.
This calculates to a maximum possible amount of memory needed as 500 MB (5 x 1kb x 100,000).
Therefore the following changes were made:
- Changed the JVM arguments to give the ActiveMQ broker 2GB of RAM.
- Added a new policy entry into the ActiveMQ configuration for queues with VirtualTopic.Process.Result in the name and set the memoryLimit=200mb. Since there are 5 queues named this way that would equal 1GB.
- Added a new policy entry into the ActiveMQ configuration for the topic with VirtualTopic.Process.Incoming in the name and set the memoryLimit=200mb.
- Changed the policy entry in the ActiveMQ configuration for all other queues to use a memoryLimit=20mb. This will give plenty of memory to the other queues. Since there are about 20 other queues, this would equal 400MB.
- Changed the memoryUsage limit=2048mb. This leaves 600 mb for ActiveMQ to use as overhead.
Since we made these changes, the system has performed without further incident.
See the example activemq.xml with the configuration changes.
References
http://activemq.apache.org/xml-configuration.html http://activemq.apache.org/performance.html http://activemq.apache.org/virtual-destinations.html http://java.dzone.com/articles/activemq-understanding-memory http://activemq.apache.org/producer-flow-control.html https://activemq.apache.org/wildcards.html http://activemq.apache.org/per-destination-policies.html http://activemq.apache.org/how-do-i-enable-debug-logging.html https://web.archive.org/web/20121119035041/http://fusesource.com/docs/esb/4.3.1/amq_tuning/amq_tuning.pdf